




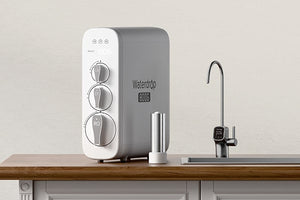


Waterdrop's 1st Annual Water Quality Survey Shows Chlorine Is the Most Concerning Matter in Tap Water
by
Dr. Jonathan Doyle - Updated January 26, 2026


To gain deeper insight into public awareness of water safety and consumer trends in Canada, Waterdrop launched the Annual Water Quality Survey. This initiative will be conducted every year to track Canadians' perceptions, concerns, and behaviors regarding drinking water safety.
For the first annual report, Waterdrop conducted an online survey using a structured questionnaire throughout October 2025. A total of over 1,000 responses were collected globally, including nearly 200 samples from Canadian consumers.
Home Water Awareness
Home Tap Water Quality in Canada
Our survey found that 39% of Canadians rated their home tap water as good, while 45.5% considered it average, and 8.6% thought it was poor. A small portion, 2.7%, were unsure about their water quality, and 4.3% indicated other situations.

These results suggest that while many Canadians have relatively positive perceptions of their tap water, nearly half feel only average confidence, highlighting room for improvement in water quality awareness and safety measures.
Related article: Which water is best to drink in Canada?
Basis for Judging Tap Water Quality
Canadians rely on multiple factors to assess their water quality. The taste or flavor of water was the most cited factor, with 66.8% of respondents using it to evaluate water safety. Water appearance, including clarity and color, influenced 46%, while 42.2% referred to personal water test results. Local water utility reports or notifications were considered by 22.5%, and 14.4% consulted national or local news. Only 3.2% had no specific basis for judging water quality.
Sources of Drinking Water at Home
When asked about their primary drinking water sources, 46.5% of Canadians reported municipal water, and 34.8% used filtered tap water. Private wells supplied water for 11.8% of respondents, while bottled water and delivery services accounted for 2.1% and 1.6%, respectively. A small number, 3.2%, used other sources.
This indicates a growing preference for safer and cleaner water through filtration systems in Canadian households.

Knowledge About Tap Water
Regarding knowledge of tap water, 11.8% of respondents considered themselves well-informed, 43.3% had some knowledge, and 31.6% had basic knowledge. Another 11.8% admitted to having little knowledge, and only 1.6% said they knew nothing about their water.
This shows that most Canadians have at least some awareness of water quality and potential contaminants, reflecting a growing interest in safe water practices.
Sources for Pollution-Related Information
Most Canadians rely on authoritative sources for information about water pollution, cited by 75.4% of respondents. Social media or forums influenced 47.6%, friends or family experiences 28.9%, and neighbor notifications 15%. A small portion, 3.2%, do not follow pollution-related news.
This demonstrates that Canadians actively seek trustworthy information regarding water safety. Waterdrop publishes water related articles on a regular basis to help all customers understanding water safety and human health.
Top Water Contaminant Concerns of 2025
The survey revealed that Canadians are most concerned about chlorine (53.5%) and lead (50.8%), followed closely by hard water minerals (46%) and microplastics (45.5%). Microorganisms and fluoride were also common concerns, affecting 42.8% and 41.7% of respondents respectively. Pesticides, arsenic, VOCs, and nitrates were noted to a lesser degree, while 3.7% did not recognize any contaminants.

This suggests that microplastics have emerged as a rising concern, alongside traditional contaminants such as lead, reflecting a shift in public awareness.
Awareness and Concern About TDS
Total Dissolved Solids (TDS) levels were a concern for many Canadians. In the survey, 27.8% were very concerned, 11.8% somewhat concerned, 18.2% moderately concerned, 12.3% slightly concerned, and 29.9% were not concerned at all.
While TDS itself is not toxic at common levels, high TDS may indicate the presence of other contaminants and can affect taste, odor, and aesthetic quality. Canadians are becoming more conscious of these factors when evaluating water safety.

Water Use Scenarios Where Quality Matters
Daily drinking water was the top priority for 97.3% of respondents. Cooking water mattered to 69.5%, bathing or showering to 29.9%, and ice for the fridge to 24.6%. Pet drinking water (28.9%), toilet water (21.4%), and laundry (18.2%) were also considered, while plant watering, car washing, and swimming pool water were less commonly prioritized.
This demonstrates a holistic awareness among Canadians about water quality across multiple household uses.
Consumer Insights
Health Impacts Related to Water Quality
The survey showed that 55.1% of Canadians reported no health problems linked to water quality. However, 23% experienced skin allergies, 16.6% digestive issues, 7% eye or throat irritation, and 25.1% dry skin or hair problems. Other reported effects included headaches or fatigue (5.3%) and heavy metal concerns (2.7%).

Importantly, 21% of respondents reported experiencing two or more health issues related to water quality, indicating that poor water may affect multiple aspects of household health .
Consumer Motivations for Water Filtration
When Canadians encounter negative water quality reports, 60.4% said they would purchase water filtration products, while 40.6% would test their home water. Other responses included contacting water utilities (18.7%), buying bottled water (16.6%), consulting water professionals (17.6%), and seeking medical advice (4.3%).
The primary motivations to purchase filtration systems included health protection (78.5%), removal of specific contaminants (78.9%), and improving taste and smell (65.5%). Around half of respondents also sought solutions for hard water.
Water Filtration Products Canadians Use
Among Canadians who have installed water filtration products, tankless reverse osmosis (RO) systems are most common, used by 51% of households, chosen mainly for health protection and effective contaminant removal. Refrigerator filters (28.3%) and under-sink purifiers (26.3%) are also popular for improving taste and odor. About 17.4% use water softeners, and 12.5% have whole-house filtration systems, ensuring safer water for bathing, cooking, and laundry.
Predictions for Water Quality Trends in 2026
Canada is likely to see increased focus on reducing emerging contaminants such as PFAS (“forever chemicals”) through stricter regulations and public awareness campaigns. Rural areas, often dependent on private wells, may receive more attention regarding water safety monitoring. Climate change and aging infrastructure will continue to pose challenges for water quality and supply, emphasizing the importance of household filtration and proactive monitoring.
References
1. Health Canada. (n.d.). Guidelines for Canadian drinking water quality . Government of Canada. https://www.canada.ca/en/health-canada/services/environmental-workplace-health/reports-publications/water-quality.html
2. Government of Canada. (n.d.). Per- and polyfluoroalkyl substances (PFAS) and human health . https://www.canada.ca/en/health-canada/services/chemicals-product-safety/per-polyfluoroalkyl-substances.html
3. World Health Organization. (2017). Guidelines for drinking-water quality (4th ed.). World Health Organization. https://www.who.int/publications/i/item/9789241549950
4. World Health Organization. (2019). Microplastics in drinking-water . World Health Organization. https://www.who.int/publications/i/item/9789241516198
5. Organisation for Economic Co-operation and Development. (n.d.). Water security for better lives . https://www.oecd.org/water/water-security/

Choose Your Water Solutions
- Smart Reverse Osmosis System No Tank, No Bacteria
- Water Filter for Sink Space & Water Saving
- Refrigerator Water Filter Pure Water, Effortlessly
- Water Filter Pitcher Stay Hydrated Always
- RO System Replacement Filters Change Your Filters Regularly
Categories
- Buyer's Guide Complete buying guides to help you choose wisely
- Water Contaminants Offer the best solution to solve the water problems
- Water Stewardship Responsibility for sustainable water management
- Home and Wellness A better and healthier world for individuals and families
- Customer Voice Take a look at how other users evaluate Waterdrop


